From Waste to Water: A Framework for Sustainable Freshwater Supply in Northeastern Illinois7/19/2023 
0 Comments
Earlier this year, I co-authored a R package related to environmental justice (EJ) with two colleagues at US EPA (Morgan Teachey in the Office of Water and Adam Theising in the National Center for Environmental Economics). The package, hosted on EPA’s github repository, streamlines initial screening-level analyses and enables EPA staff to efficiently study multiple locations of interest. The package, EJSCREENbatch, leverages national demographic and environmental data made available by EJSCREEN, a mapping and screening tool maintained by EPA. An important feature of our package is that we improve upon the way EJ screening is performed by introducing a water-specific focus: we allow users to examine EJ characteristics in areas up- or downstream of a particular location by integrating data from the national hydrography dataset (NHD). The package has garnered a substantial amount of interest within the Office of Water and has already been used by several sub-offices as part of their EJ screening analyses. The tool is currently available as a downloadable package. 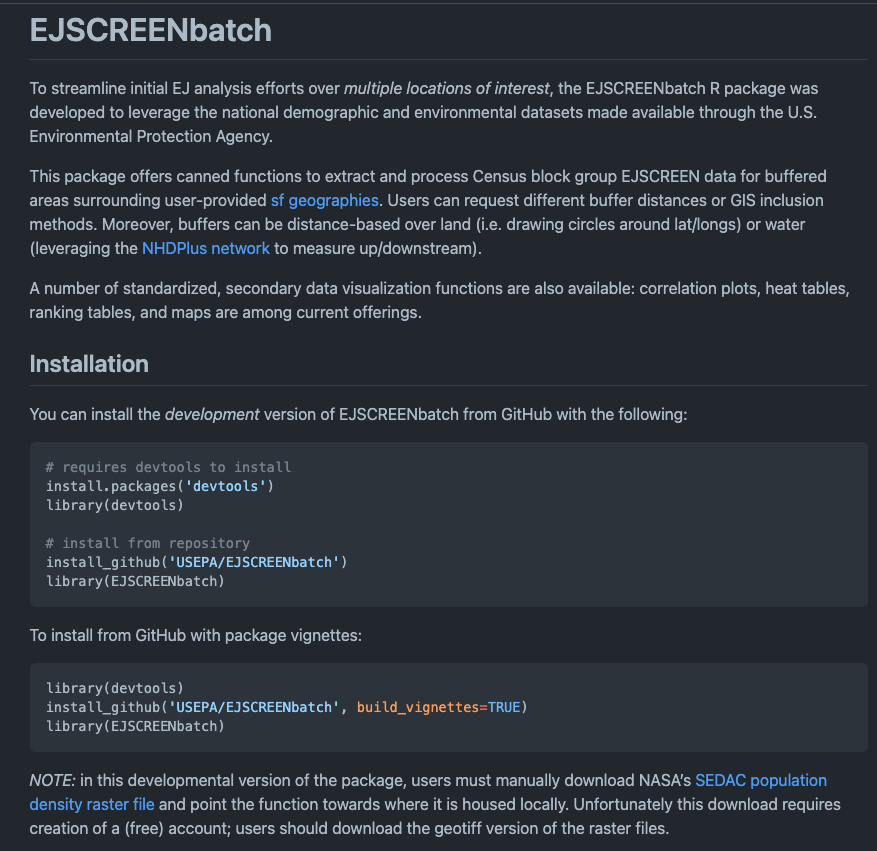 Water utilities are starting to adopt high resolution meters, a.k.a. Advanced Metering Infrastructure (AMI), that record usage at extremely high frequencies (typically one-hour intervals). Using this increased resolution can be used to derive greater insight into how customers use water and better evaluate the impact of interventions. As a consultant for Xylem Vue Inc., I conducted a study for California Department of Water Resource (CA DWR) to disaggregate residential indoor water usage from outdoor water usage using high frequency hourly data measured at the hourly level. The study was part of a larger effort to inform CA DWR’s recommendation for a residential indoor water usage standard. For this study, I adapted the machine learning approach I had previously developed to identify likely irrigators to instead distinguish between the different ways a particular household uses water. I then applied the methodology to over 290,000 customer accounts across four water utilities using a year’s worth of data for each customer.  |